Penny Rowe
Software Engineer & Data Scientist
Datasets
Publications
Time Series
Radiation: Model Validation
The energy we receive from the sun, or shortwave radiation, depends on a lot of factors, including latitude, time of day, time of year, and how reflective the surface is. We also receive longwave radiation through the greenhouse effect. Clouds complicated the picture - they reflect shortwave radiation but trap longwave radiation.
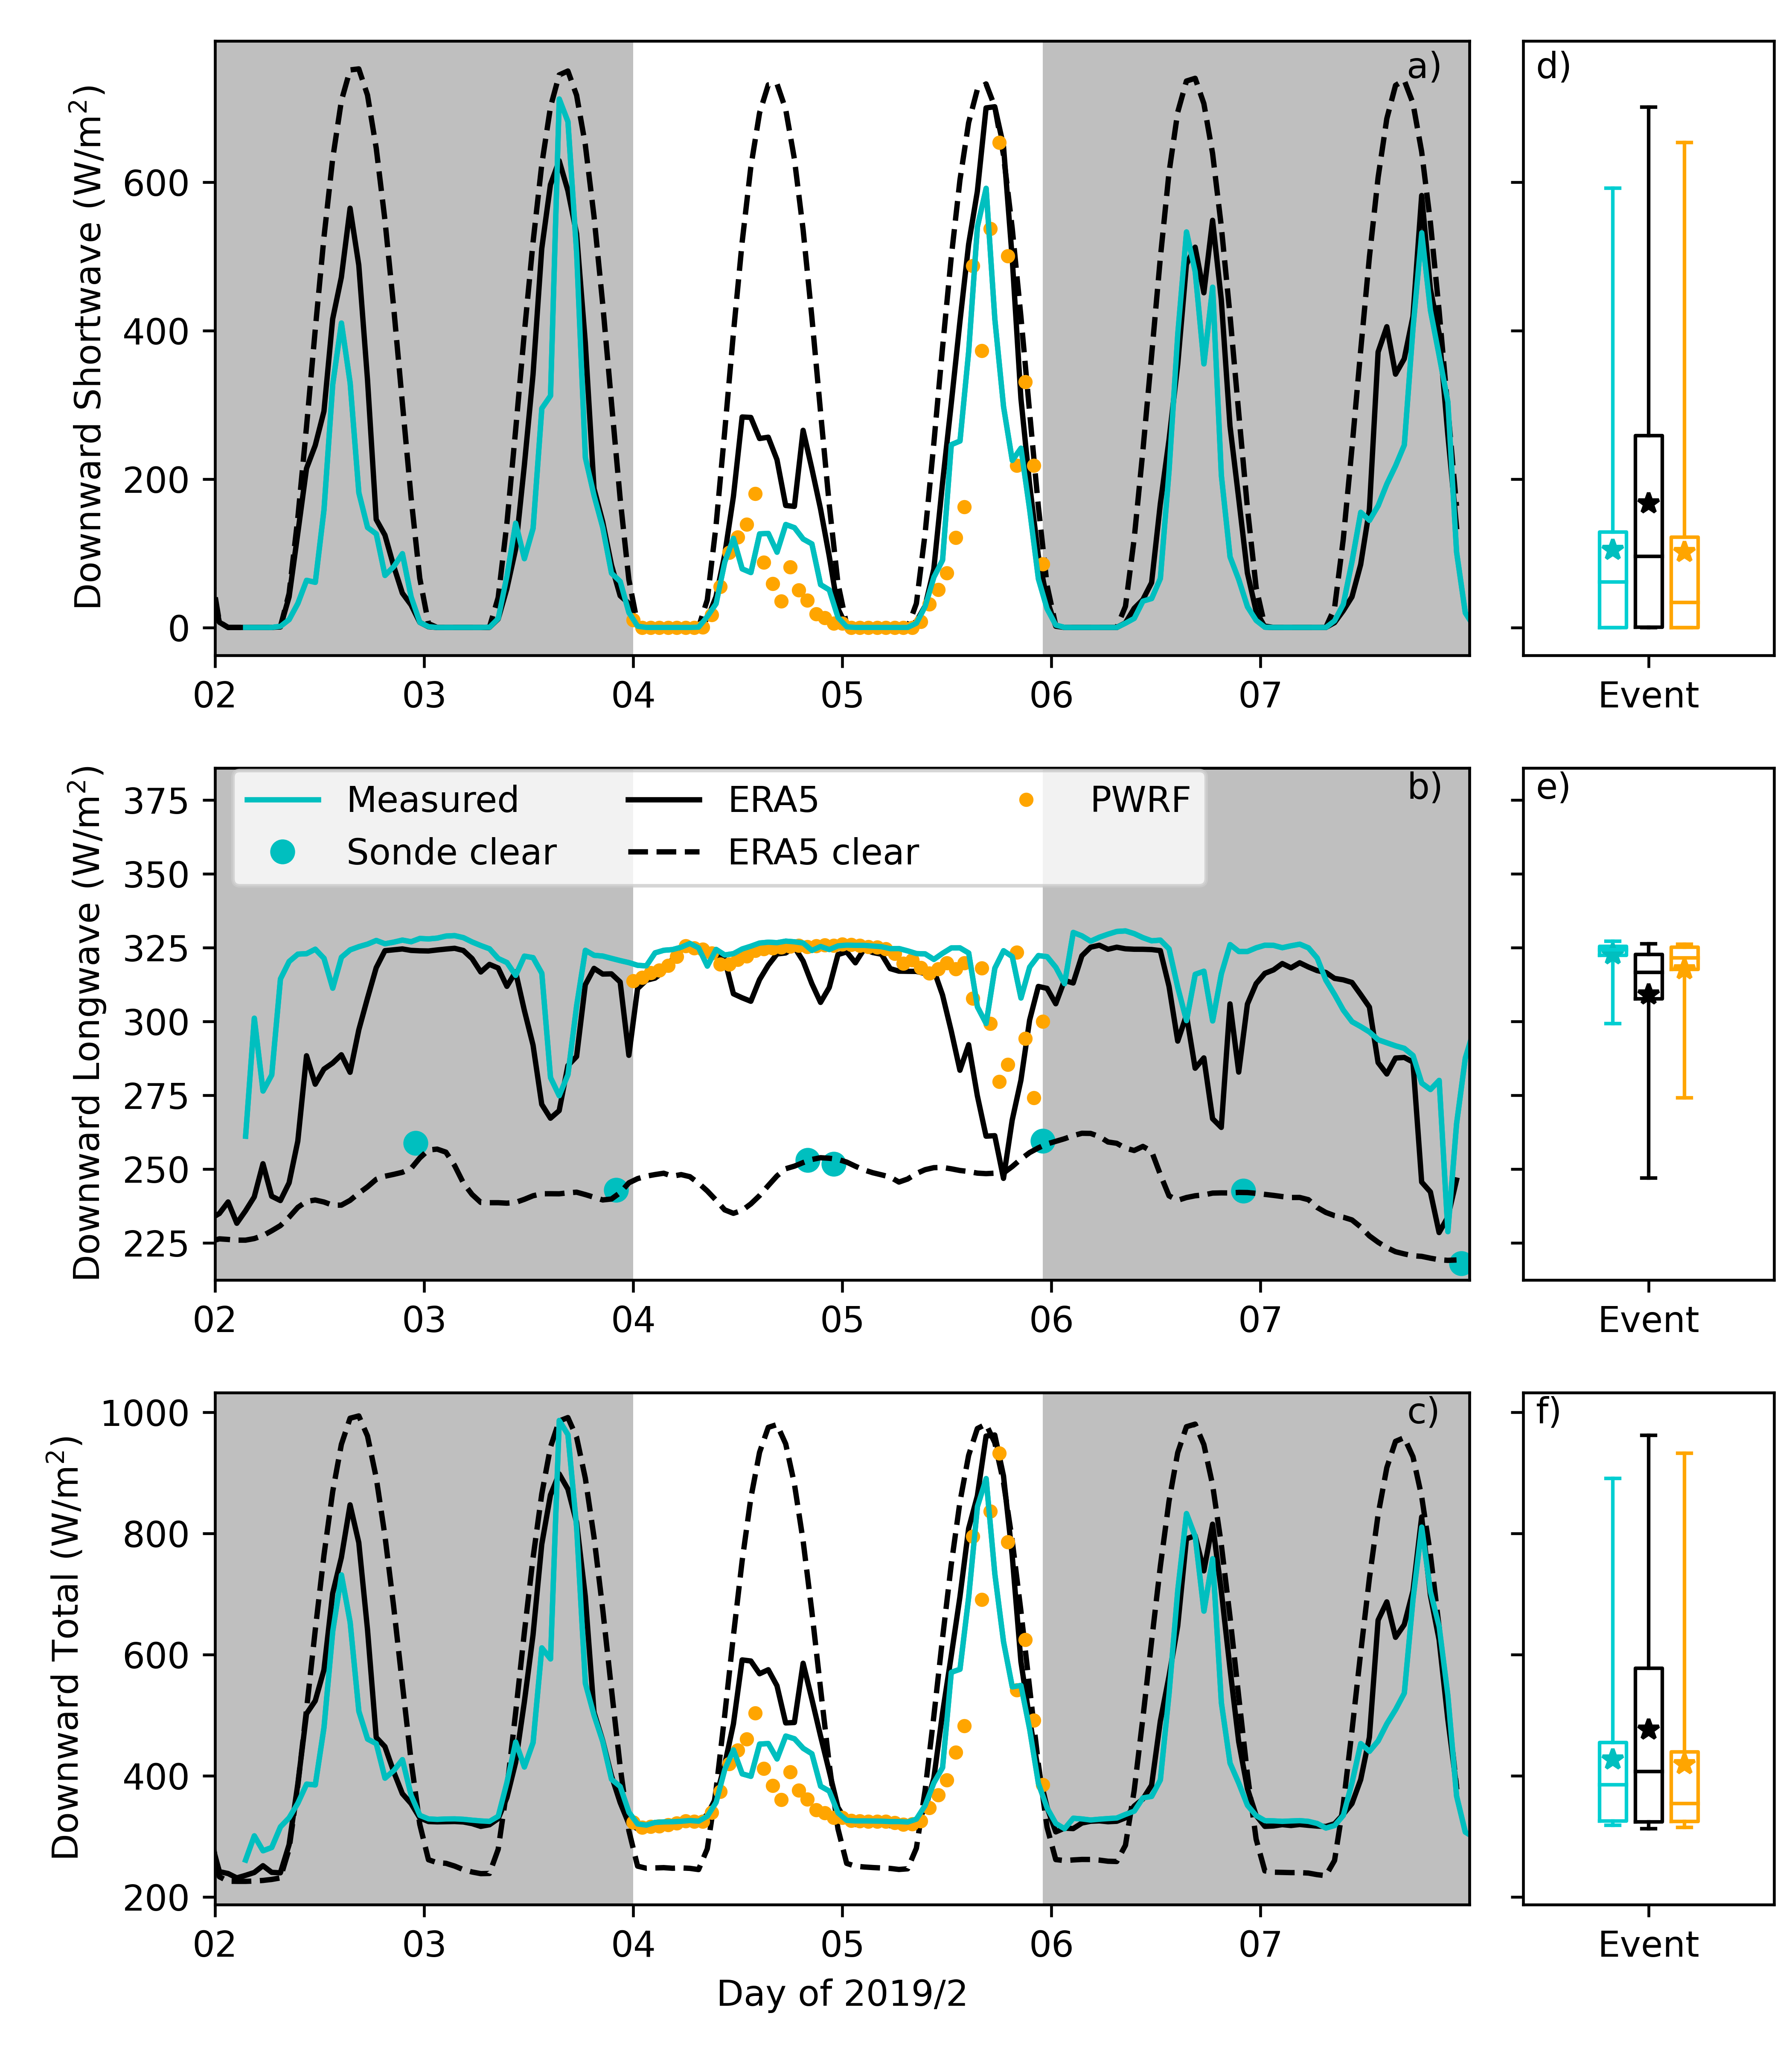
The figure shows the amount of radiation reaching the surface over a summer week in Antarctica. The figure packs in a lot of information. Measurements are shown in light blue, while results from two different models (ERA5 and Polar WRF) are shown in black and orange. The dashed line shows what we would expect to measure if there were no clouds; the difference between the blue line and the dashed line is called the cloud forcing. In the top panel we can see how the shortwave radiation rises and falls over the course of a day.
To compare the measurements to the models, we average each over a fixed time period. The box-and-whiskers summarize the statistics over the time period highlighted in white, allowing us to compare the mean, median, interquartile, and range between measurements and models.
Determining the Annual Cycle
To see the how radiation varies over a year we average first over each month and then over a span of years in order to smooth out variations due to as many other factors as possible.
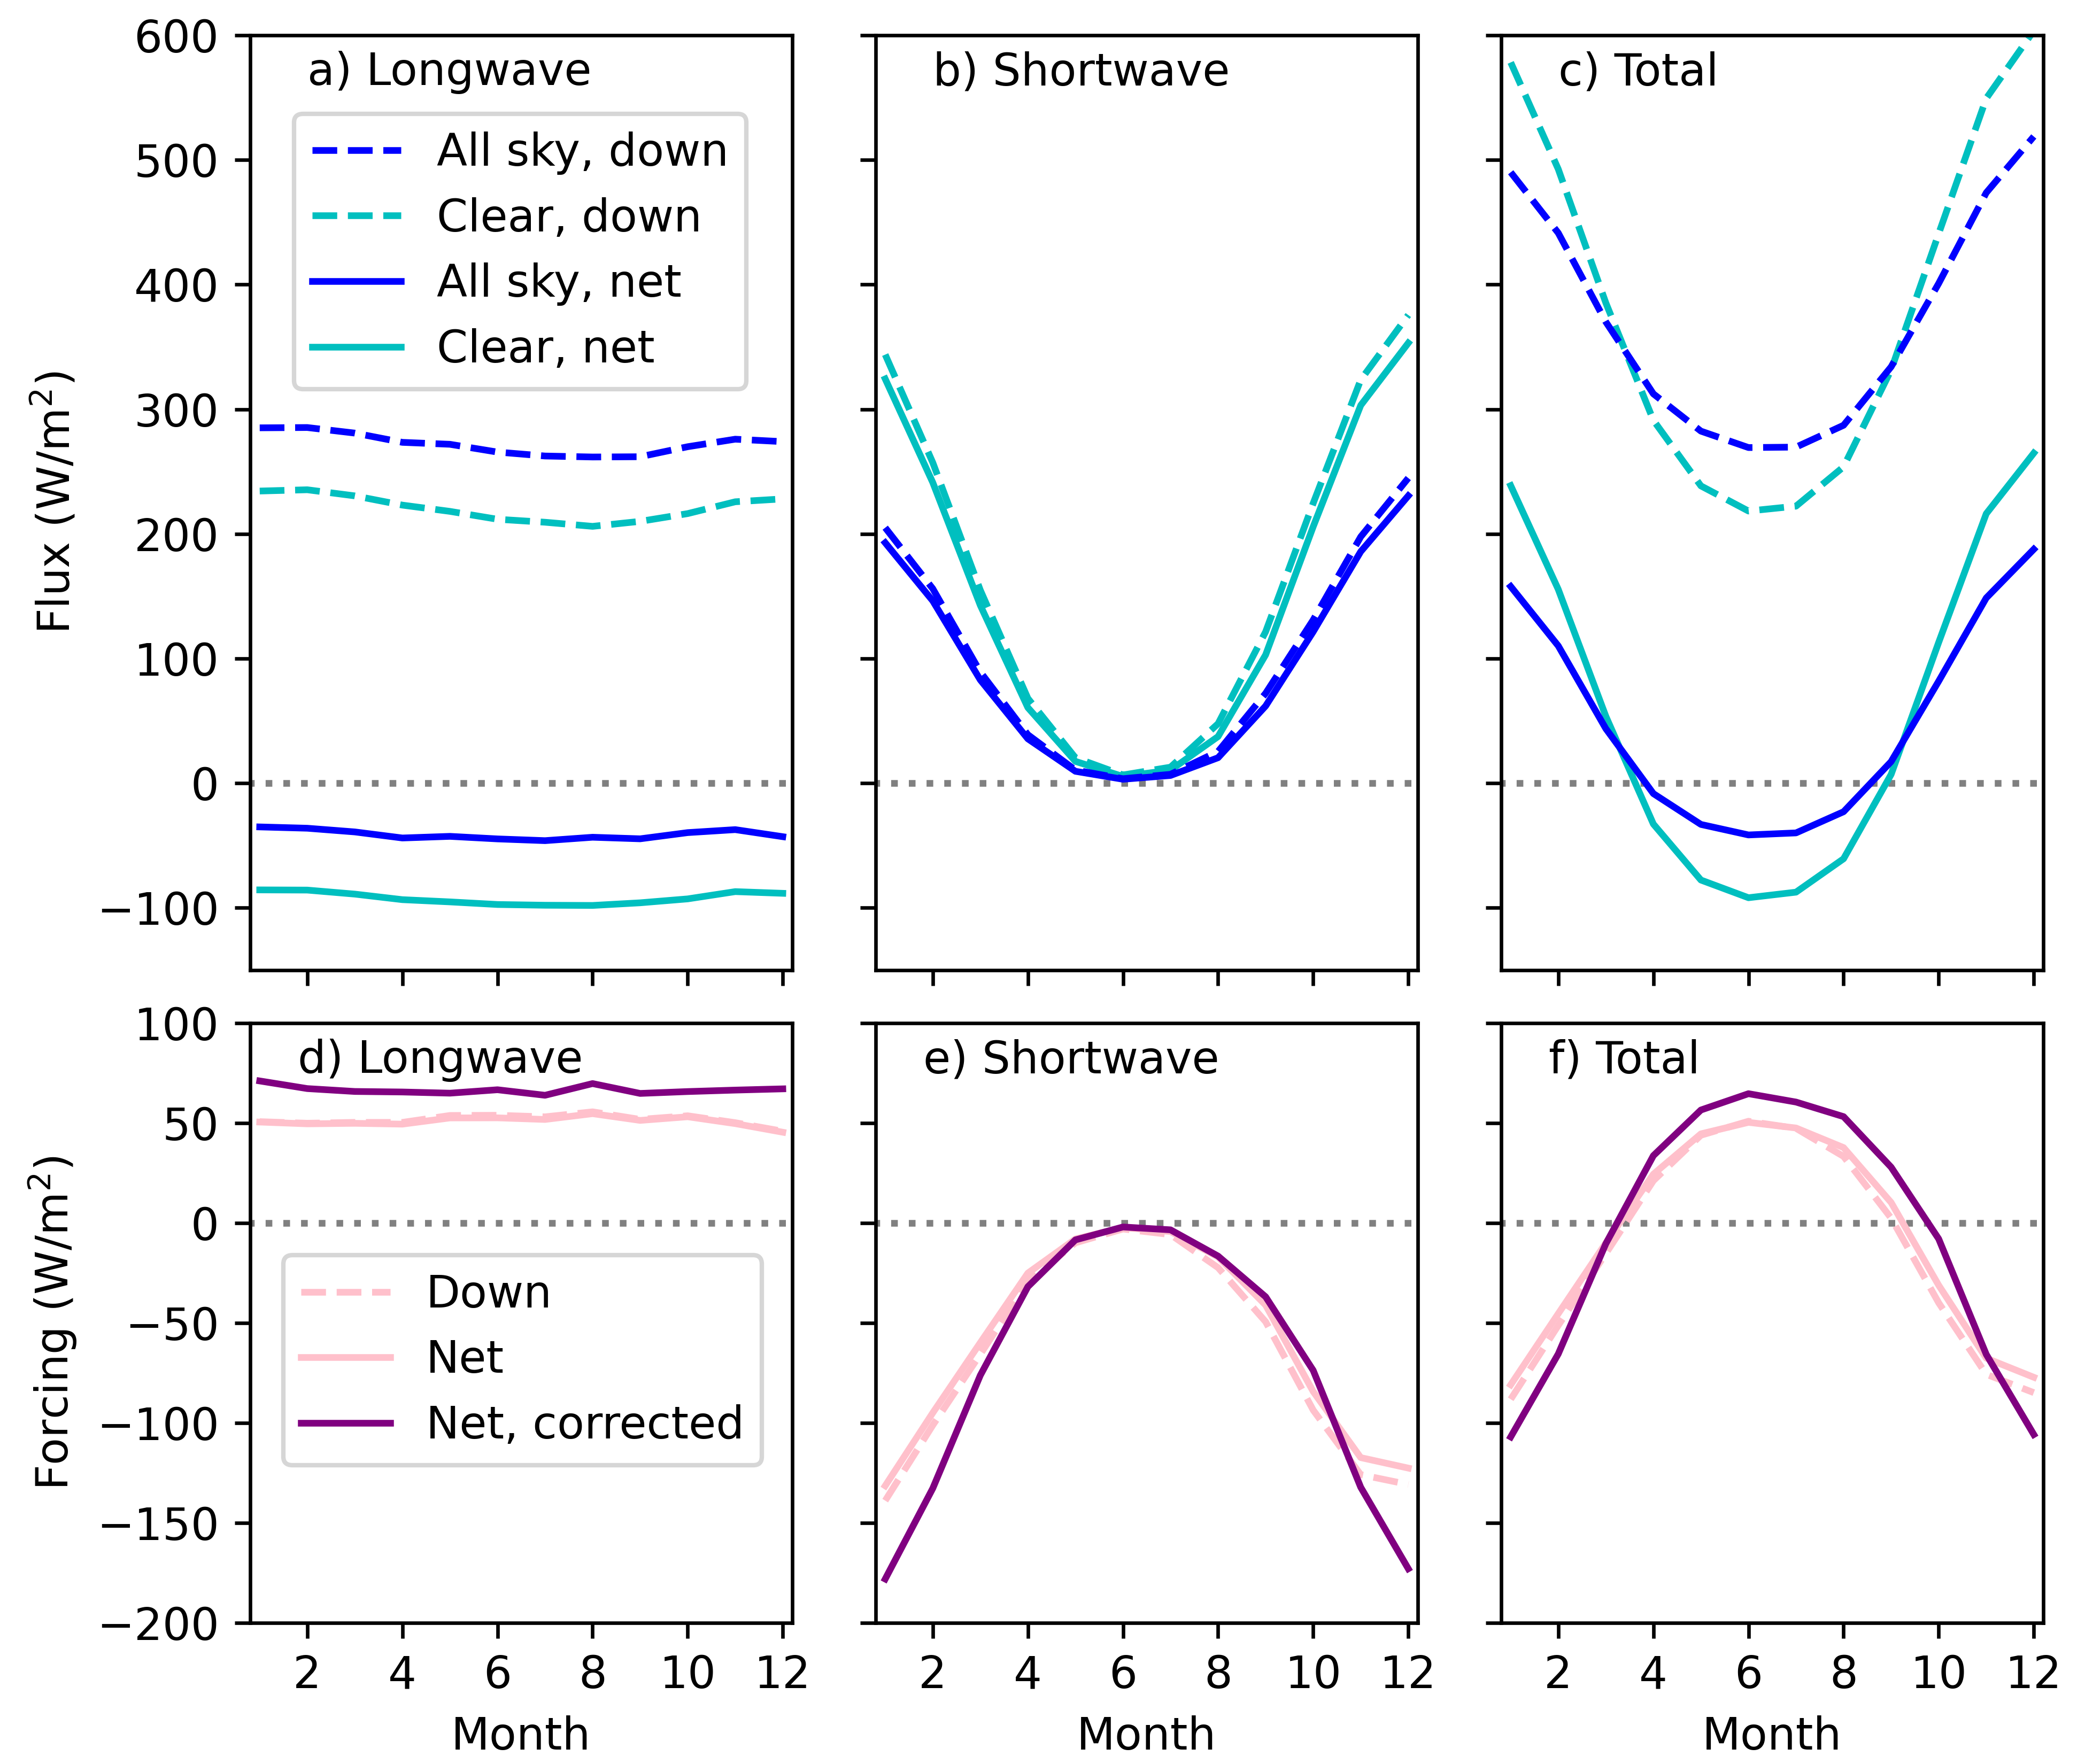
The figure to the right shows the monthly average radiation over the years 2017-2023 at the Chilean Antarctic research station Escudero. Like the previous figure, a lot of information is condensed into the this figure.
Focussing on just the lower right hand corner, this panel shows the influence of clouds on the net radiation at the surface. Positive means clouds are causing a warming and negative means clouds are cooling. We can see that clouds cool overall in the Antarctic summer and warm overall in the winter. Because of gaps in the measurements, a model was used here. This model was corrected for a bias that was found by comparing to the measurements, as shown by the purple curve.
Survey Analysis
Polar ENgagement through GUided INquiry (PENGUIN) is an NSF-funded project to develop modules that teach polar research to undergraduate students in a variety of courses. In this project students were surveyed before and after completing the module. The surveys were analyzed to measure changes in students self-assessment of knowledge gains and determine whether they made quantitative knowledge gains.
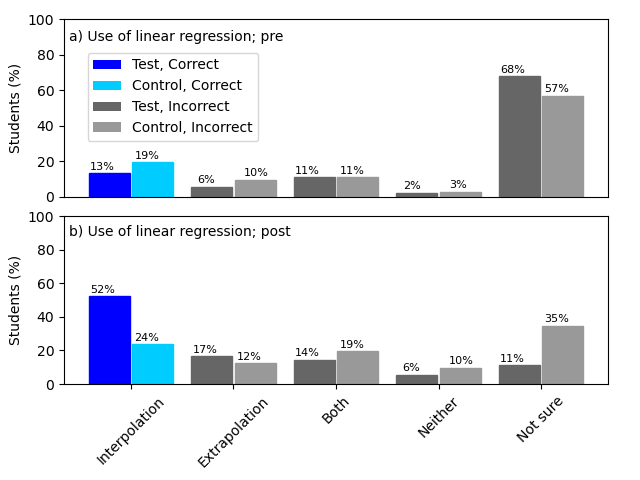
Example of aggregated student responses to a survey question for students in statistics classes before and after taking the module (dark blue and gray in top and bottom panels), as well as for statistics students who did not work through the modules (light blue and gray in top and bottom panels). Blue indicates the correct response while gray indicates incorrect responses.
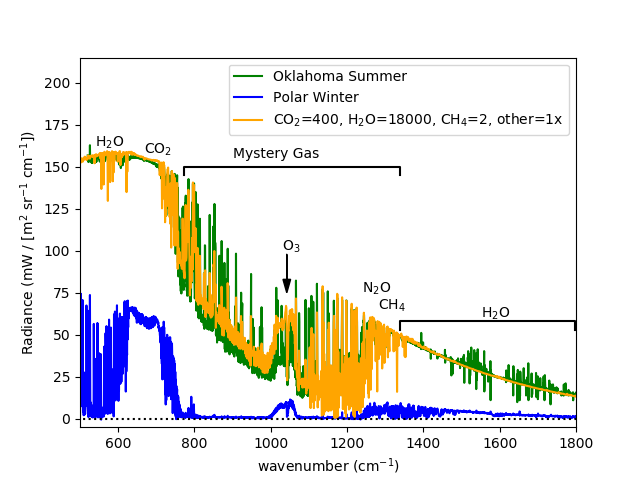
A figure from a PENGUIN module taught in Quantum Mechanics. Students examine rotational vibrational transitions in spectra and plot the greenhouse effect.
Bayesian Statistics
Cloud Property Retrievals
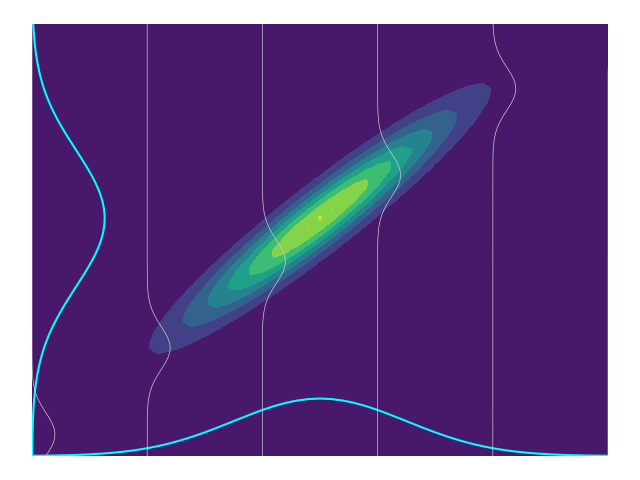
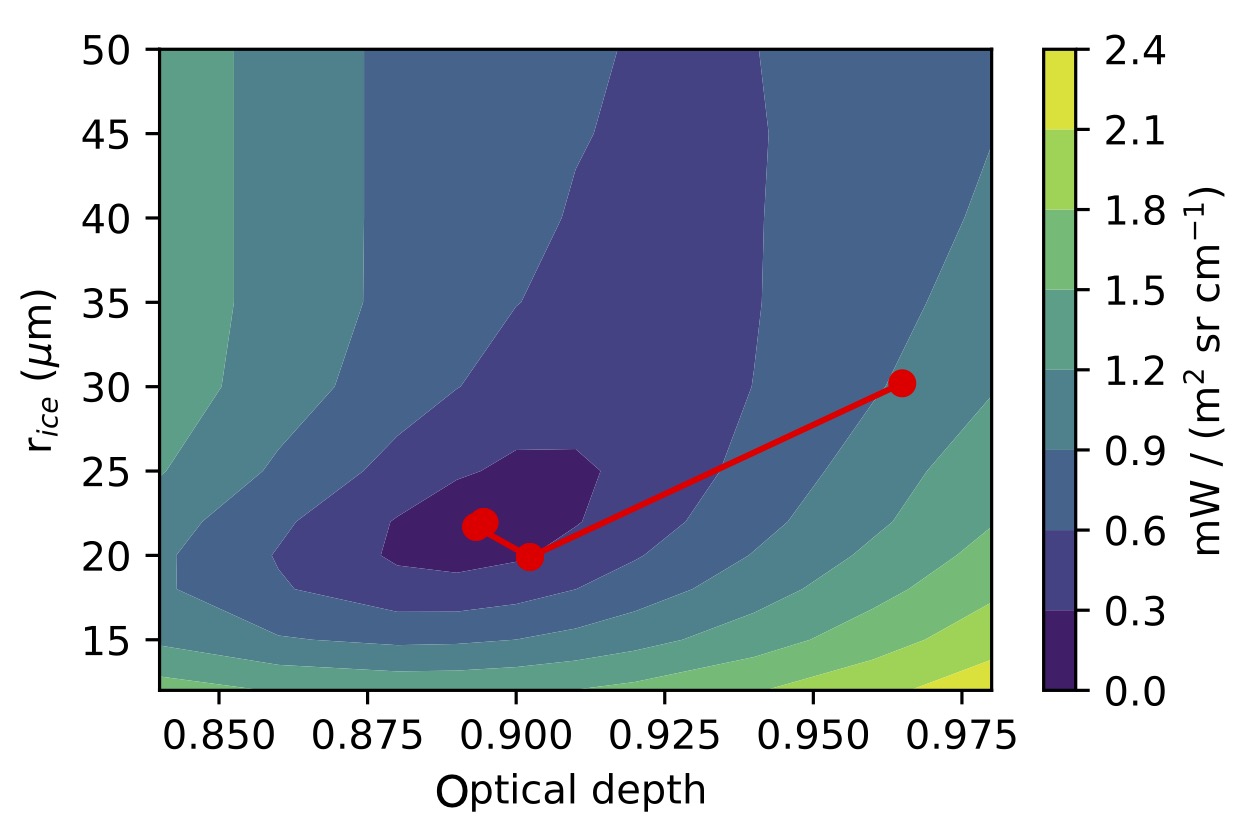
An iterative form of the Levenberg-Marquardt algorithm in a Bayesian framework is used to retrieve cloud properties from measured downwelling infrared radiation.
The figure to the right illustrates the path of a retrieval on the contour surface starting from an initial guess for several iterations. The retrieved variables are effective radius (re), related to ice crystal size, and optical depth, related to how well the crystals transmit light. The retrieval converges at the minimium.
Data Fusion
Index of Refraction
Radiative transfer calculations of supercooled liquid cloud absorption and emission of infrared radiation relies on incorporating the temperature dependence of the complex refractive indices of supercooled water.
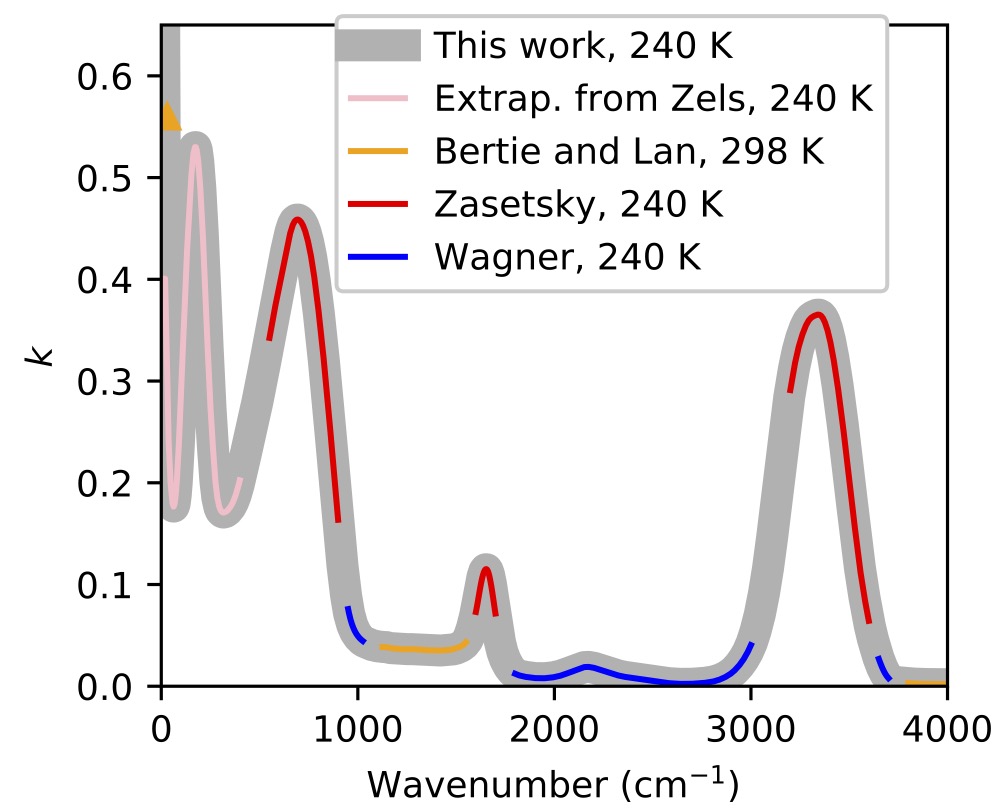
The figure shows the imaginary part of the complex-valued index of refraction of liquid water, at 240 K. This result was created by interpolating and extrapolating the results from laboratory studies at varying frequencies and temperatures.
Data Extrapolation
Black Carbon
Black carbon is an anthropogenic pollutant that decreases the albedo of ice and snow, leading to increased melting in a positive feedback loop. In the Chilean Andes, black carbon on glaciers enhances the melt rate. Because glacier melt is an important source of water for households, agriculture, and energy, understanding the timing of melt as well as glacier loss is an important topic. Snow samples from the Chilean Andes, in the Antarctic, and on Mt. Rainier were used to quantify light absorption by impurities.
The resulting point measurements were extrapolated over the broader region, requiring estimates of the snow area and location-dependent average insolation and cloud cover.
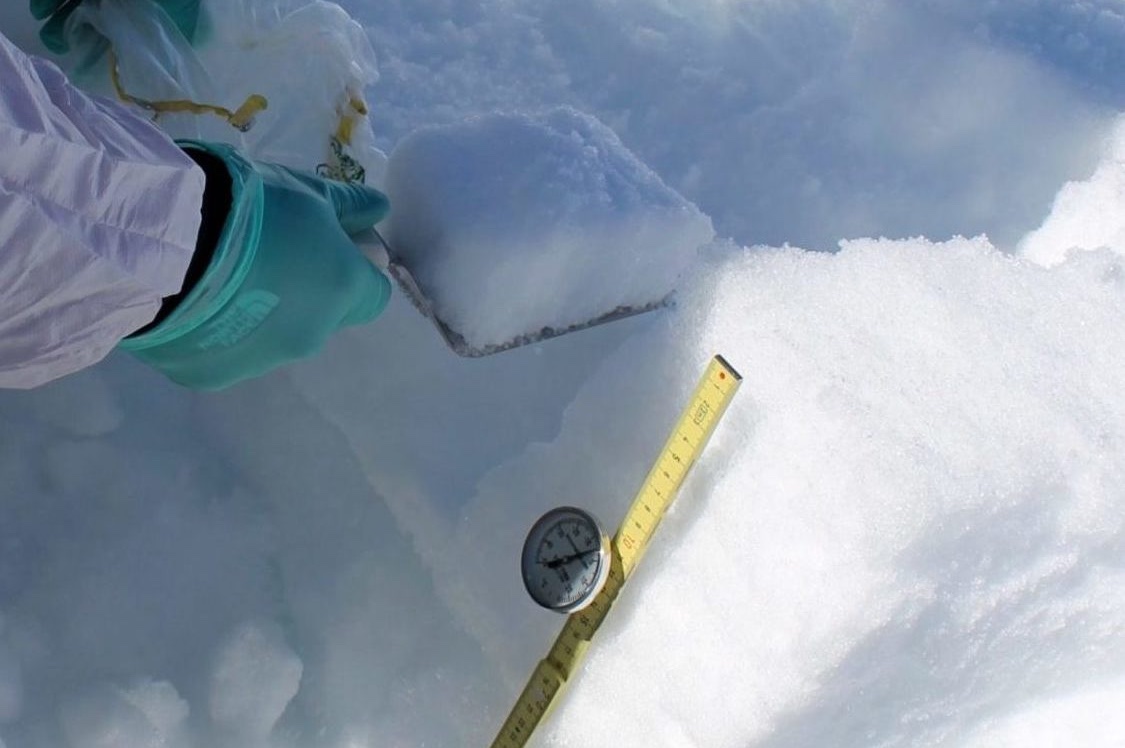
Snow sampling involved first digging a snow pit and then collecting samples successively deeper, as shown to the right.
